The Parashift user interface is designed to be user-friendly and easy to navigate. It features a clean, intuitive layout that allows users to quickly access and use the platform's features and functions. In this introduction, we will explore some of the key aspects of the Parashift user interface and how it can help users be more productive and efficient.
Basic Layout
When you log in and select a tenant, the interface opens the Document Overview page. The layout has four main components:

1. Name and Logo
- Located in the top-left corner.
- You can customize the logo for branding purposes.
2. Sidebar Menu
The left sidebar menu is your primary navigation tool and contains four key sections:
- Documents: Manage workflows and document states.
- Configuration: Set up and customize document types, fields, and workflows.
- Development: Manage API keys and webhooks for system integration.
- Reports: Access dashboards, processing statistics, and error analysis.
This sidebar is also collapsible.![]()
3. User & Tenant
The User & Tenant section in the top navigation bar helps you manage tenants and settings.
- Active Tenant: Switch between tenants via a drop-down menu (Switch tenants).
- User Settings: Access account settings and customization options (User Settings).
4. Main Content Area
The main content area dynamically updates based on the selected menu item.
Documents
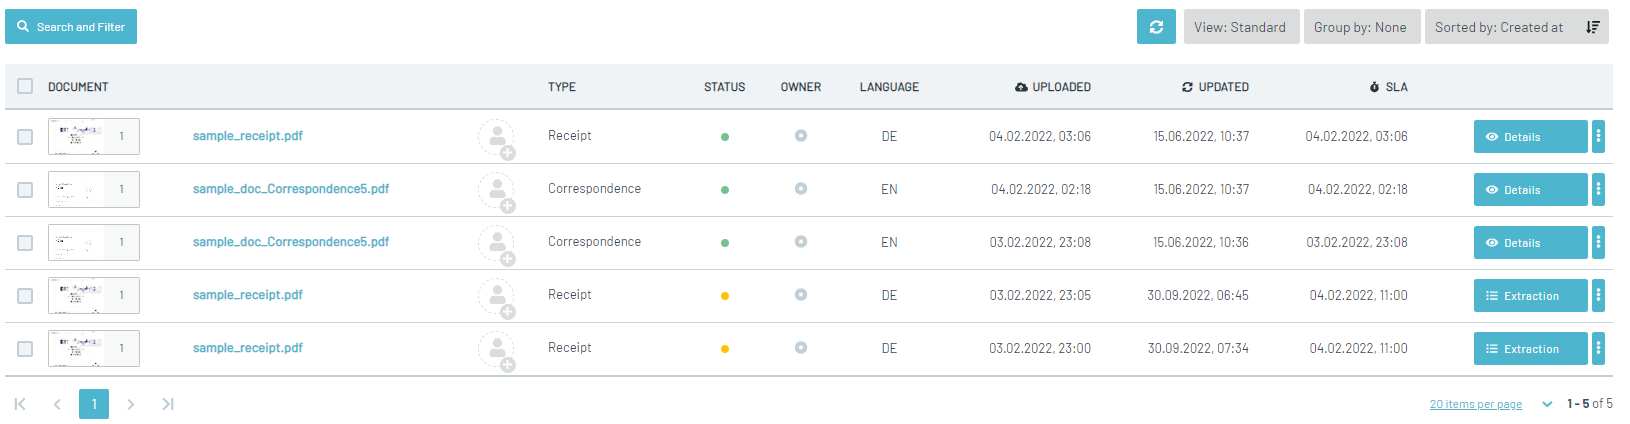
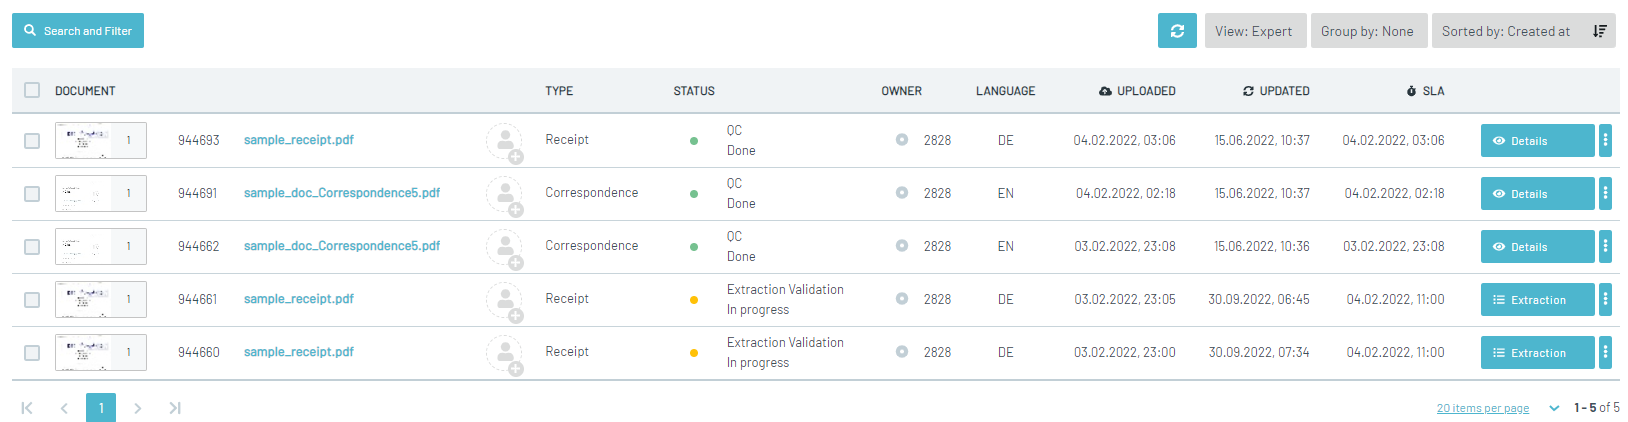
Upon clicking the "Documents" section in the left sidebar, the user is presented with five sub-sections. The first sub-section, "Overview," opens a list of all documents within the tenant in the main content area. This list provides an overview of the documents, including their names, creation dates, statuses, and more.
The remaining four sub-sections are:
- Separation
- Classification
- Extraction
- QC Operations
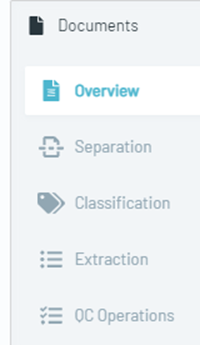
Each of these sub-sections shows only the documents currently in the corresponding stage of the document processing workflow. For example, the "Classification" sub-section will display only documents that have been separated and are now being classified.
These sub-sections help users view and manage documents in each stage of the workflow without searching through the entire list. Users can perform actions related to those stages, such as editing metadata or annotating document content.
The top bar of the main content area includes preset filters for document status (e.g., Pending, Separation, Classification, Extraction, QC, Done, Exported, Failed). Users can also create and save customized filters.

Different Sorting Criteria
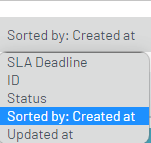
Several sorting options are available for sorting documents by various attributes.
View Modes
There are three different views available:
Default View

Standard View
Expert View
Bulk Actions
The bulk action feature allows users to perform actions like bulk classification, deletion, resetting, or copying IDs after selecting multiple documents.

Note that bulk actions will fail if any document is locked. You can view and unlock locked documents to proceed with bulk actions.
Learn more: Bulk-Actions via User Interface
Configurations
Clicking on the "Configuration" section in the left sidebar presents four sub-sections. Users can edit, delete, or create configurations for documents, fields, fieldsets, or workflows. The interface is intuitive, making it easy to manage configuration settings efficiently.
Sidebar – Configurations
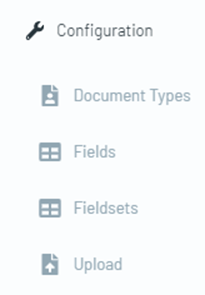
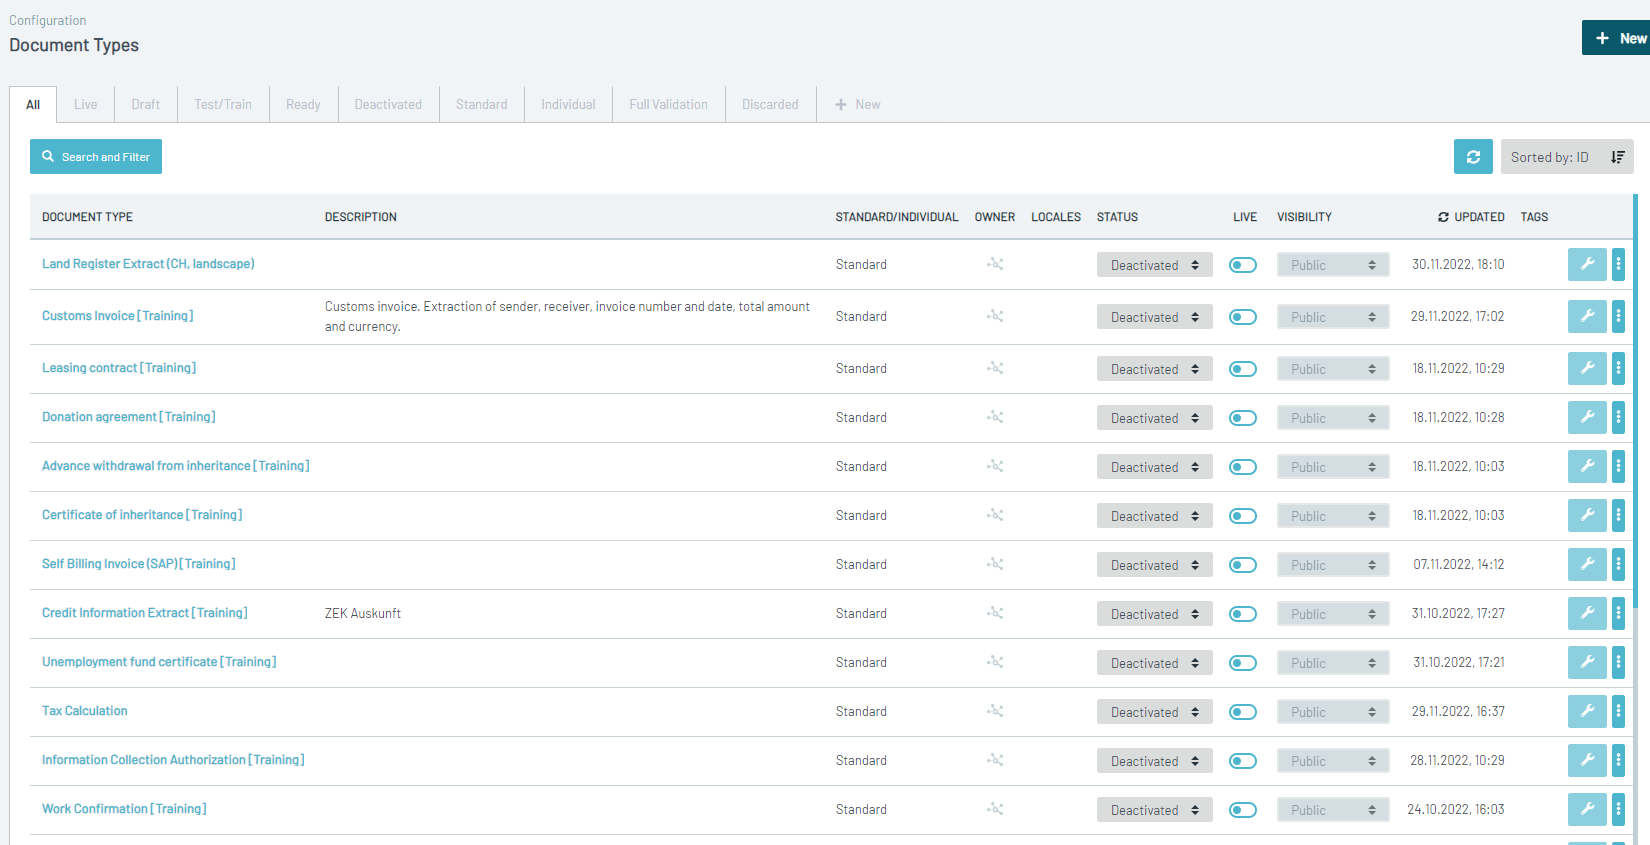
Document Types: View and edit document types, including setting default values for fields and defining document structure.
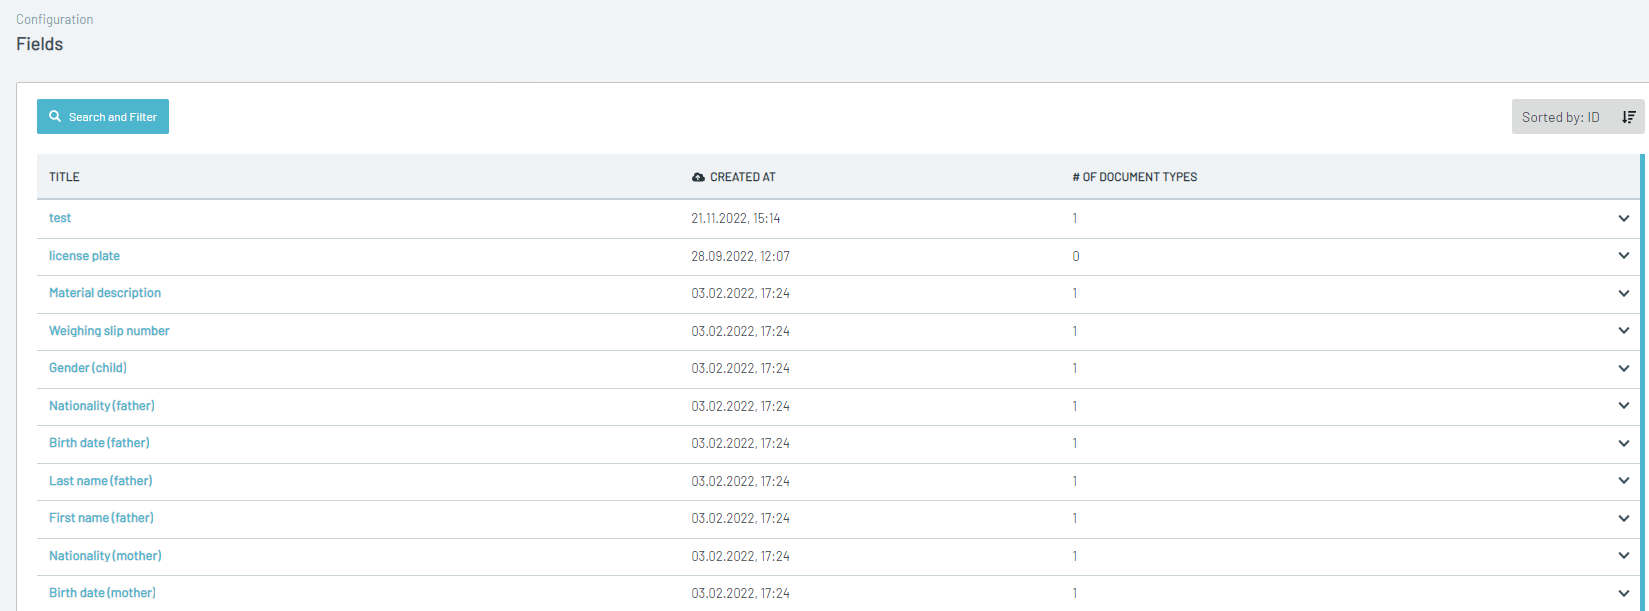
Fields: Manage available fields, including their data types, names, descriptions, extractors, verifiers, and transformers.
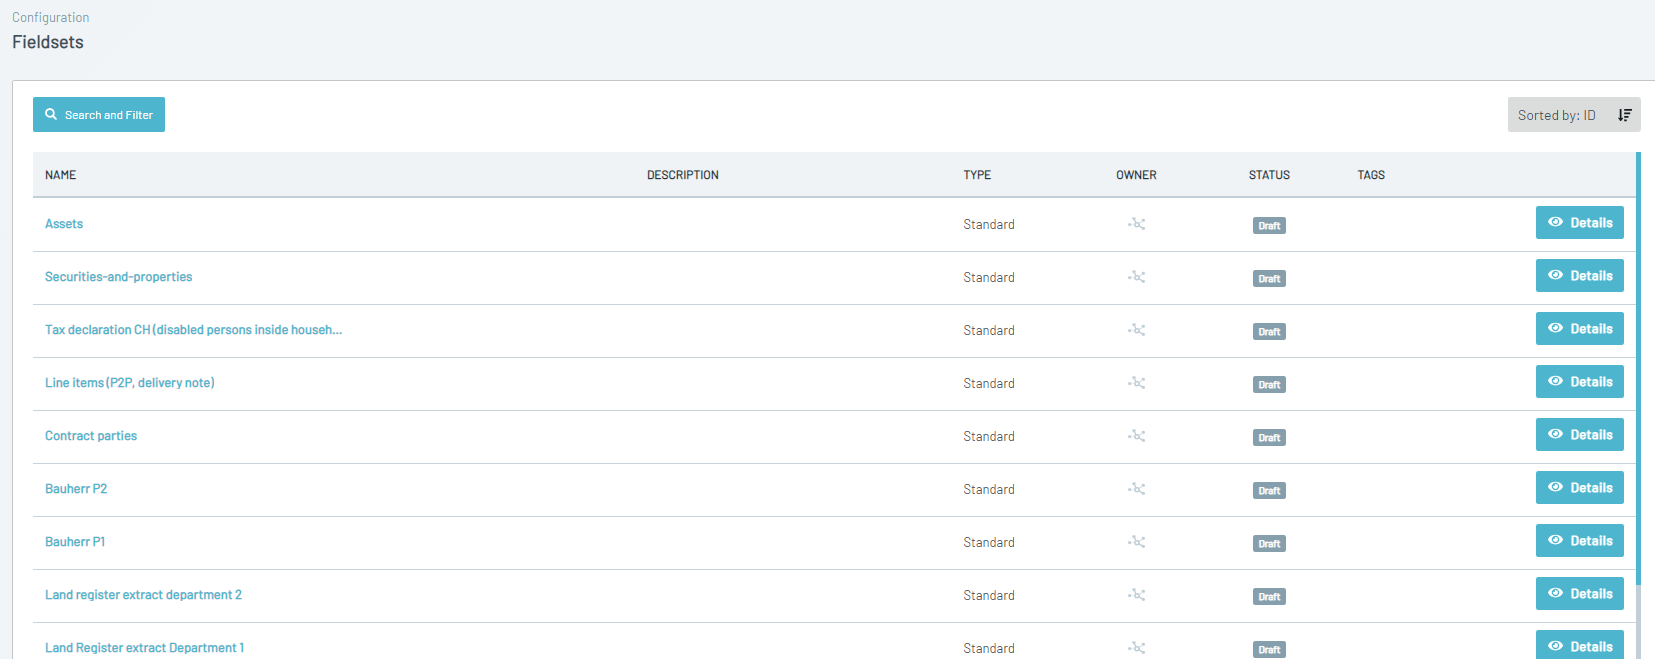
Fieldsets: View and edit fieldsets, define the fields included, and set display order and other attributes.
Upload: Create and manage upload profiles, specify workflows, and configure separation settings for each profile.

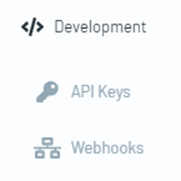
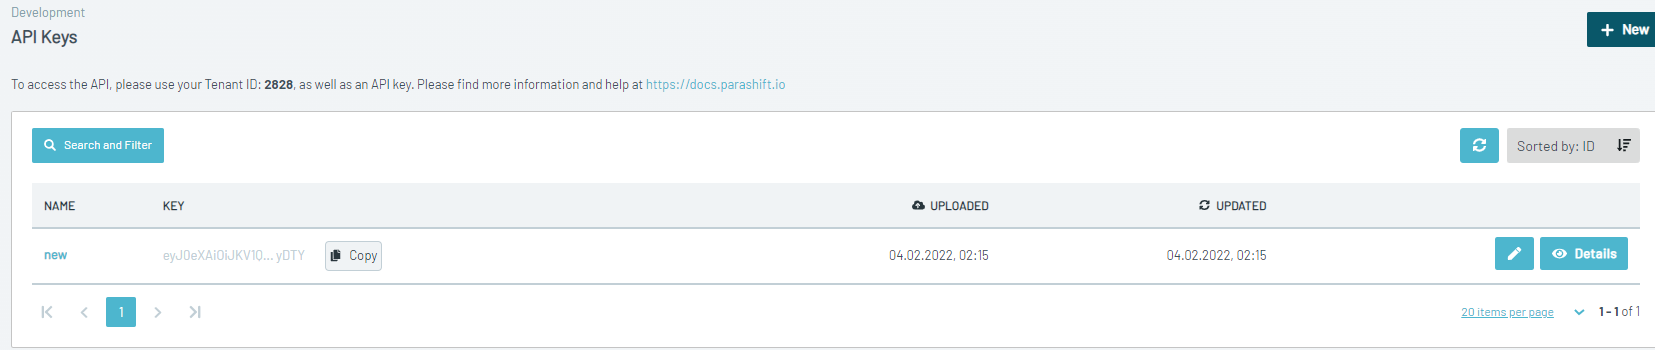
Development
The Development section allows users to manage API keys and webhooks.
Sidebar – Development
API Keys: View and edit available API keys, including setting access levels and metadata.
Webhooks: View and edit webhooks, including defining URLs, event triggers, and payload data.
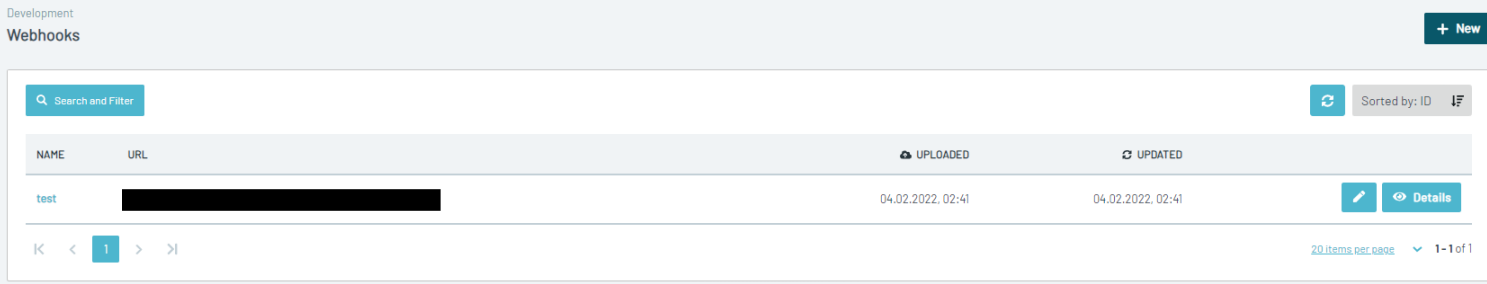
These features are essential for developers looking to integrate external systems and automate workflows within the platform.
Reports
Clicking on the "Reports" section in the left sidebar presents five sub-sections:
Sidebar – Reports
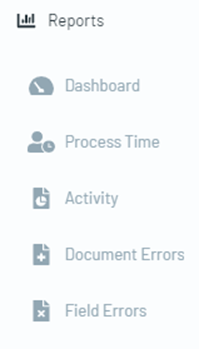
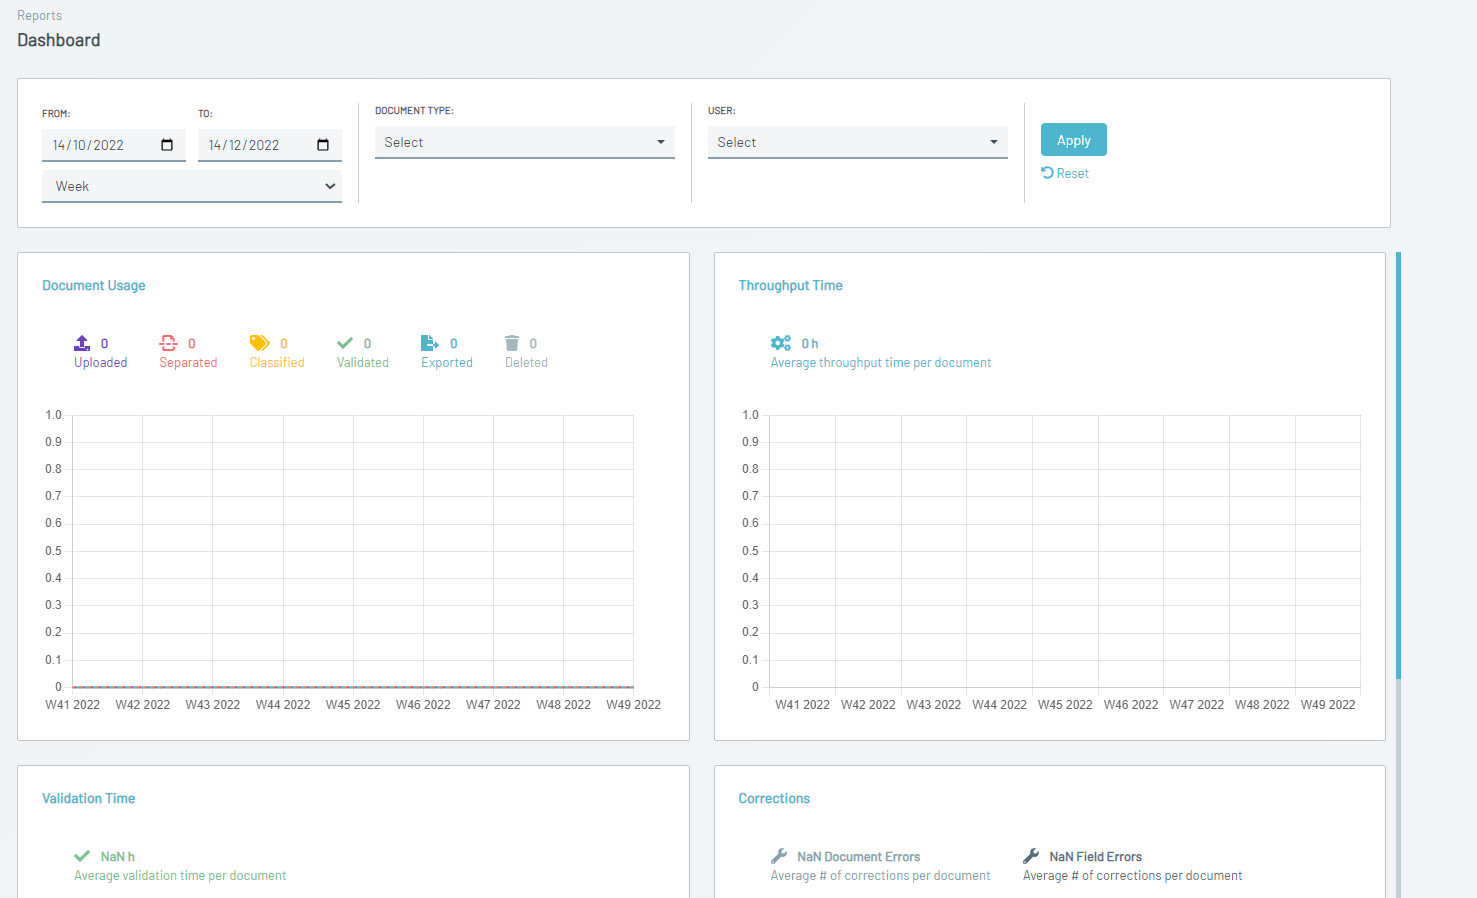
Dashboard: View various graphs and charts summarizing document usage, processing times, throughput, and corrections. Data can be filtered by time period, document type, and user.
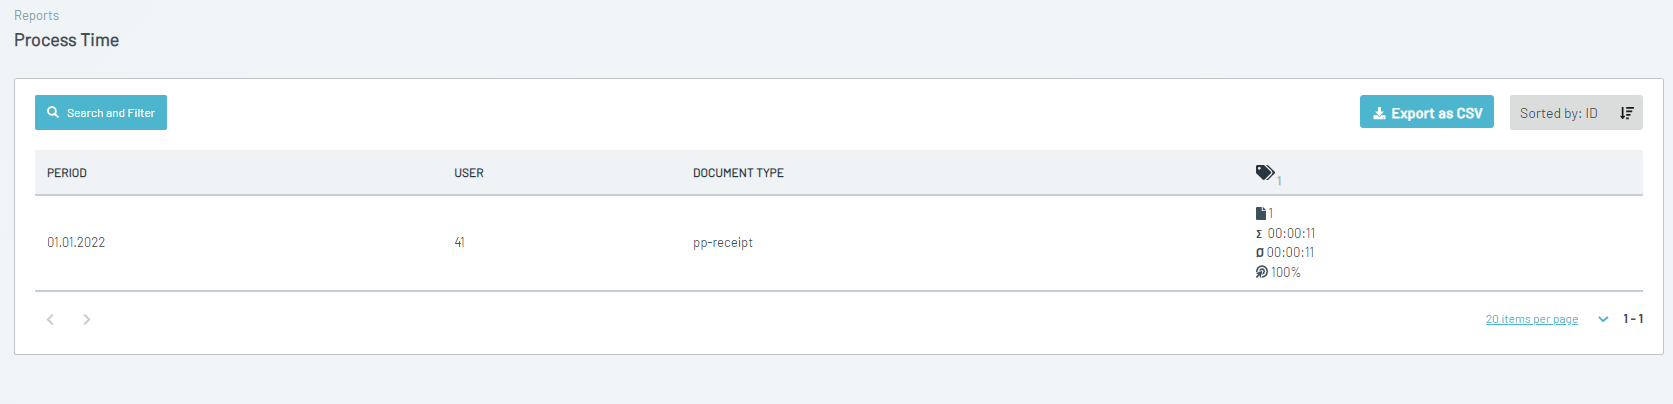
Process Time: View a breakdown of processing times for each document. Data can be filtered by time period, document type, and user.
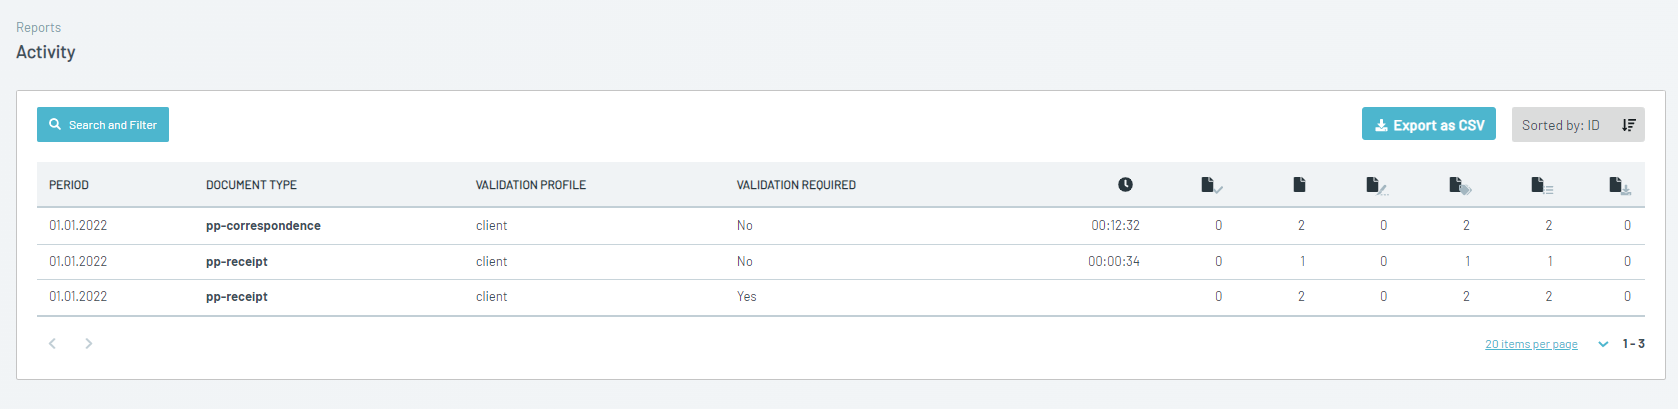
Activity: View summaries of different activities performed on documents, including processing times, service level agreement compliance, and task counts. Data can be filtered by document type, validation profile, and time period.
Document Errors: View a summary of errors during document processing, filtered by document ID, type, workflow task, and time period.
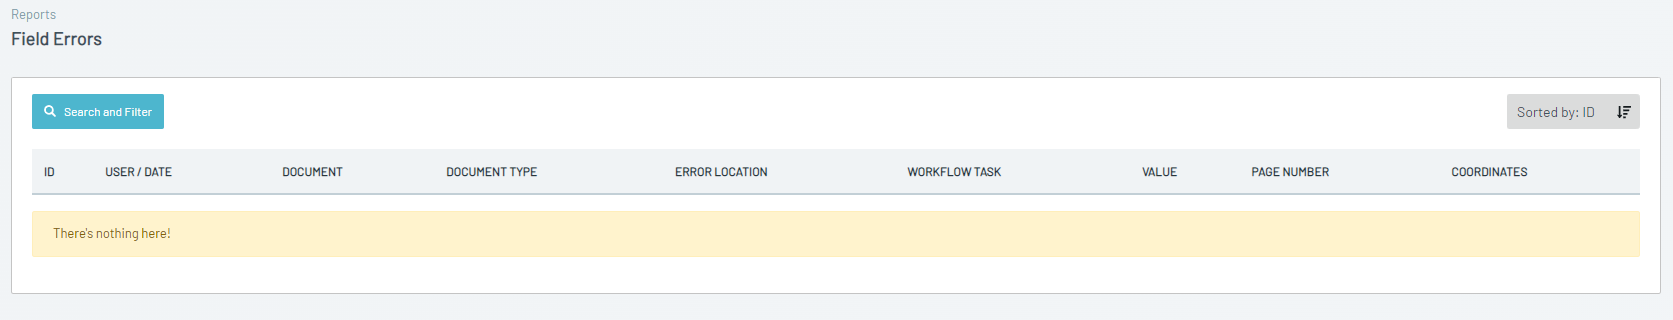
 Field Errors: View detailed breakdowns of field-level errors, including error values, page numbers, and coordinates. Data can be filtered by document ID, error location, workflow task, and time period.
Need Help?
If you encounter any issues or need further guidance, feel free to contact us at support@parashift.io. Our support team is available as part of your support package.